Digital Projects Tools
Storytelling Tools
These tools support communicating your research or project, displaying data in creative ways, and allowing exploration of information.
Omeka
Omeka is a content management system for online digital collections. It allows users to publish digital collections and create online exhibits. Omeka is user friendly and while mostly suited for cultural heritage materials, it can serve many uses. Oxford College Library has a hosted version of Omeka. If you are interested in creating an Omeka site for your project, contact Oxford College Library.
Knightlab
Northwestern University’s Knightlab makes open-source interactive storytelling tools. Tools range from easy timeline creation to storymaps and frame comparisons. A simple tool to create compelling visualizations for many kinds of projects.
Twine
Twine is a free, open-source software for telling interactive, non-linear text-based stories or interactive games. The software does not require any experience with programming.
Text Analysis Tools
We provide consultations and research assistance in text analysis. Text analysis is the process of transforming unstructured text into organized and relevant data to be used for research. Text mining software recognizes patterns in text and surfaces relevant relationships between data. This can be helpful if you have multiple texts you hope to put into conversation with each other. We can support your work in the following ways:
- Developing and formatting hypotheses to begin your text analysis work
- Getting started with text analysis tools
- Classroom instruction regarding text analysis tools and skills
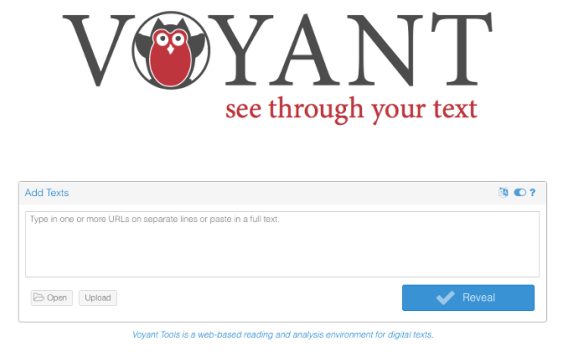
Voyant
Voyant is a simple web-based tool for text mining and visualization, intended for digital humanities scholars and students. Enter a URL or a body of text to evaluate word and phrase frequency. The tool quickly creates visualizations of the text including a word cloud, relative frequency of a word in each text section, and a berry map of words that appear closely together. A great option for beginners hoping to start thinking about what text mining can bring to their project.
ProQuest TDM Studio
TDM Studio is a text and data mining solution that allows users to easily analyze ProQuest documents, including newspapers and dissertations and thesis. Any Emory faculty, staff, and students can create an account at ProQuest TDM Studio. TDM Studio includes the workbench where users can write scripts using Python or R within TDM Studio’s Jupyter Notebook. For those not experienced in Python or R, there are visualization dashboards where users can run geographic analysis, sentiments analysis, and topic modeling without coding.
ParseHub
ParseHub is a web scraping tool that allows you to scrape data from multiple pages. No coding necessary – with a few clicks, you can set the program to repeat a series of actions (including search through forms, open drop downs, login to websites, click on maps and handle sites with infinite scroll, tabs and pop-ups) and collect info from each webpage. There is a free version, but the Oxford College Library’s subscription allows up to 10,000 pages per run.
MALLET
MALLET (Machine Learning for Language Toolkit) is an open-source tool for topic modeling based in Java. If you prefer to work in Python, there is a package called Little Mallet Wrapper by Antoniak. MALLET uses Gibbs sampling and very efficient methods to identify topics based on clusters of words that often appear together. MALLET is intended for more advanced users who feel comfortable writing code and have specific questions to be answered with natural language processing and topic modeling.
Mapping Tools
We provide consultations and research assistance in mapping and GIS tools. We can support your work in the following ways:
- Access to GIS software on our desktops in the library
- Consultations regarding GIS and mapping for your own research or course work
- Classroom instruction regarding GIS and mapping software and skills
ArcGIS
Geospatial software for creating maps allowing users to view, edit, and analyze geographic data. ArcGIS can be found on the three PCs in the Oxford College Library Information Commons. Emory Students, Staff and Faculty can contact the Oxford College Library for more information about getting a License for their personal computer or to use ArcGIS cloud applications. Note: ArcGIS is Windows-only. If you cannot come to the library but would like to use ArcGIS and own a Mac, please contact the library and we can suggest alternatives.
Storymaps
A web-based program that allows you to create mixed media "stories" using maps, images, and text. You can create a free public account for StoryMaps, but free accounts have limited functionality and are for non-commercial, non-government use. Through Emory you can get a Storymaps license to access more features. To find out more about getting a license, contact Oxford College Library.

QGIS
QGIS is an open-source Geospatial software for creating maps allowing users to view, edit, and analyze geographic data. QGIS is free to use. QGIS can be downloaded and used on a variety of computers and systems.
Other Tools
We also support a variety of other digital projects tools. Oxford Librarians are always willing to explore more tools and ideas with you - simply reach out to the Digital Projects Team!
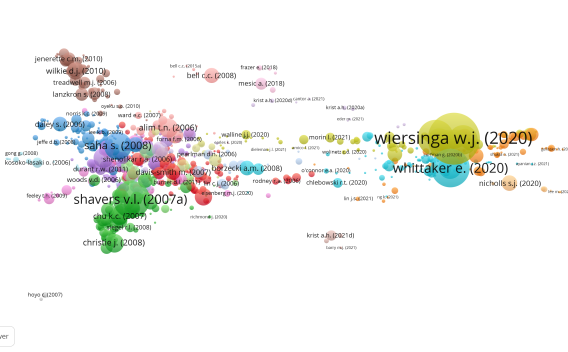
VOSViewer
VOSViewer is an open-source tool for creating visualizations of bibliometric networks. You can create maps of the connections between journals, researchers, or individual publications based on citations, co-citations, co-authorship, and more. VOSViewer also has some limited text mining functionality. One great advantage is the ability to import data downloaded directly from Web of Science, Scopus, PubMed, or WikiData. The visualizations resemble heat or cluster maps. VOSViewer is a powerful tool but can be intimidating for beginners to get comfortable with – for help, contact the Oxford College Library!
OpenRefine
OpenRefine is a free tool for working with messy data: cleaning, transforming, and much more! This tool is great for correcting data inconsistencies and clustering similar values to make working with tricky data easier. It also offers powerful faceting and data exploration options – quickly count data points that match a specific criteria and use that criteria to make subsets of data for visualization. You can even pull data directly from Wikidata. OpenRefine is user-friendly and has excellent tutorial documentation for beginners.
Audacity
Audacity is an open-source sound-editing software. The software is compatible with Mac OSX, Windows, Linux, and other operating systems Audacity can be downloaded for free and is on all Oxford College library Laptops.
Hypothesis
Hypothesis is a free tool for collaborative annotation. Using the browser extension or Canvas integration, users can take notes or write thoughts on top of readings, articles, etc. Many plugins and integrations have been created by the community as well. A great tool for collaborative annotated bibliography assignments, or allowing students to view themselves as participants in an evolving scholarly conversation.
Have a project idea? Email us!